Admin Analytics and ROI Dashboard

Curious how your advocacy program and efforts are impacting your company? We've got you covered.
Admins can access the analytics and ROI dashboard to determine your program's reach, level of engagement, and what and who is driving the most engagement. This provides keen insights so you can take action and use it to drive results for your team.
🔹 This is available on the Teams, Enterprise, and Unlimited plans.
🔹 Starter plans can access Admin > Analytics to see the basic reporting dashboard.
🔸 This feature is accessible to Admin.
Click Admin on the top navigation to be taken directly to your Analytics and ROI Dashboard.
Let's review the ROI Dashboard, then dive into specific analytics and details.
ROI Dashboard
The ROI Dashboard is the Analytics default page. The dashboard is a collection of data that assigns a default value to followers and engagement, based on estimates found in our research. The ROI Dashboard provides a real-time estimate of the marketing costs for the followers, clicks, and engagements you receive sharing from EveryoneSocial.

Edit ROI Dashboard values
You can edit values for the ROI Dashboard if you know your company's average cost per follower, the average cost per click, and the average cost per engagement for respective platforms. Editing these options will provide you with the most accurate data possible. Change ROI Dashboard values with the following steps.
- Click Edit Values.
- Insert the new value in the appropriate field(s).
- Click Apply.
Once new values are applied, the chart will take a few seconds before displaying newly calculated values.
🔷 Note: Edited values will only show for the Admin who made the changes.
Below the ROI Dashboard, you'll see a few more charts that dive into top-level data.
- What's going on internally? High-level review of the top-level actions users are taking.
- What's going on externally? High-level review of shares made from EveryoneSocial.
- Popular posts: Charts displaying internal posts that receive the most reactions and shares.
- External share data: Charts displaying external shares that receive the most engagements.
- User data: Learn which users are the most active.
- Group data: Dive into top-level details about popular and newly created Groups.
Let's look at report types that are accessible in Analytics.
Groups report
Navigate to Group Analytics by clicking Groups on the left-side menu. You'll see the Groups dashboard, which presents an overview of how your Groups are performing—engagements and post count.

In the CSV report, you'll find the following.
- Group settings: Content settings, moderators, etc.
- Members: New and total.
- Internal activity: Reactions and content contributions.
- External activity: Shares, clicks, engagements, and network-specific.
Click here to learn more about the Groups report.
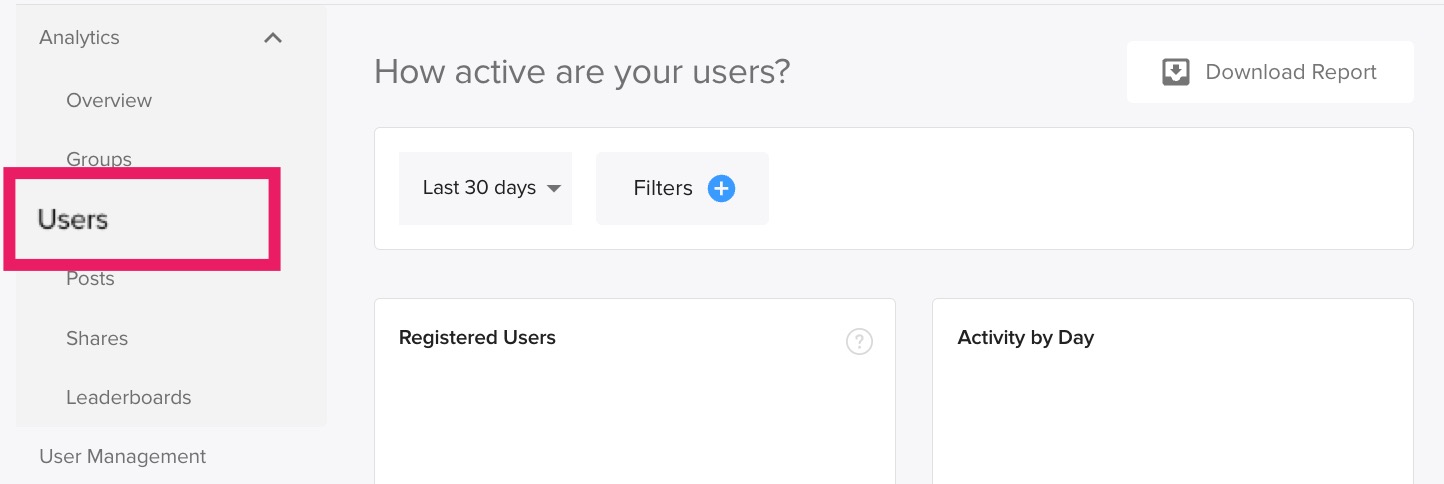
Users reports
Navigate to User Analytics by clicking Users on the left-side menu. You'll then see the Users dashboard, which presents an overview of how users perform—engagements, reach, and post count. The report will only show data for users who were active during the selected timeframe. For example, a report that pulls data for the last 7 days will only show users' data if they were active in the last week.
You'll have the option to click Request Report for “Internal Engagement” or “External Activity” with the User Analytics report.
“Internal Engagement” CSV includes metrics for your team's actions inside EveryoneSocial.
- User details: Name, email, user role, department, location, etc.
- Internal activity: Group management details, etc.
- Post details: post-type details, post engagements received, etc.
“External Activity” CSV includes metrics for actions your team takes outside EveryoneSocial.
- User details: Name, email, user role, department, location, etc.
- External sharing activity: External reach, shares, clicks, and engagements.
- Network-specific data: Connected accounts, overall reach, branded vs non-branded content.
Go here to learn more about the Users reports.
Click here to learn how to mark content as branded.
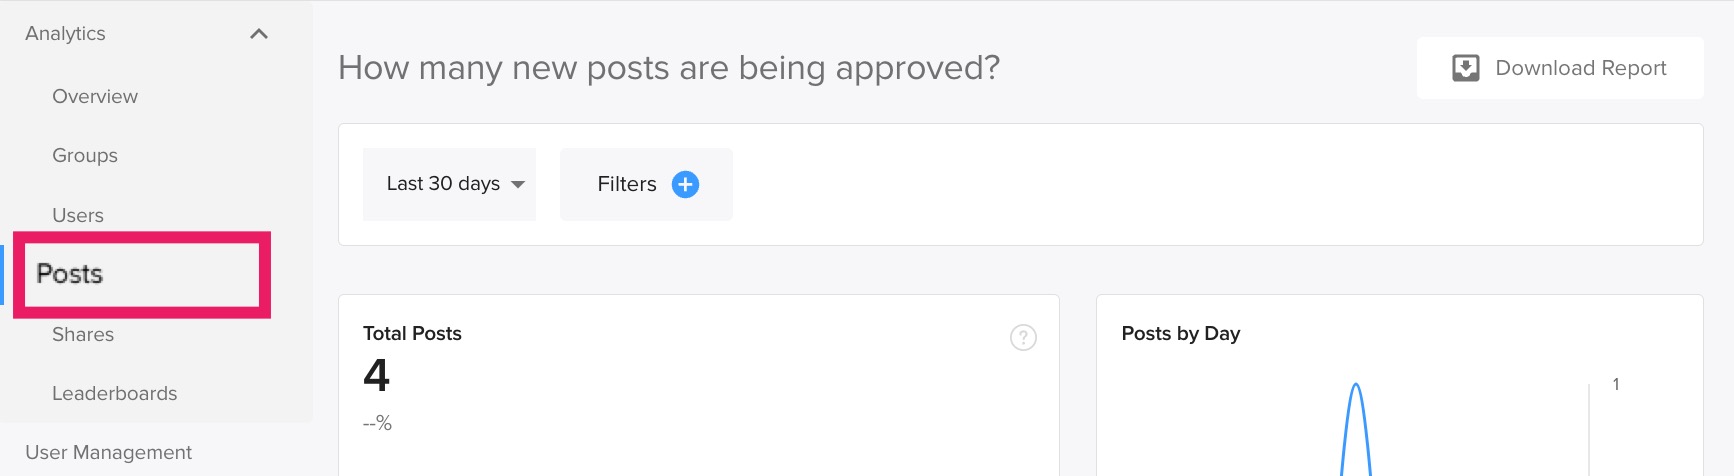
Posts report
Navigate to Post Analytics by clicking Posts on the left-side menu. You'll then see the Posts dashboard, which presents an overview of how Posts perform—reactions, shares, and branded content.
In the CSV report, you'll find
- Posts activity: Reactions.
- Post type: Engageable, shareable, image, url, etc.
- Content details: Groups, commentary and disclosures, titles, descriptions, etc.
Click here to learn more about the posts report.
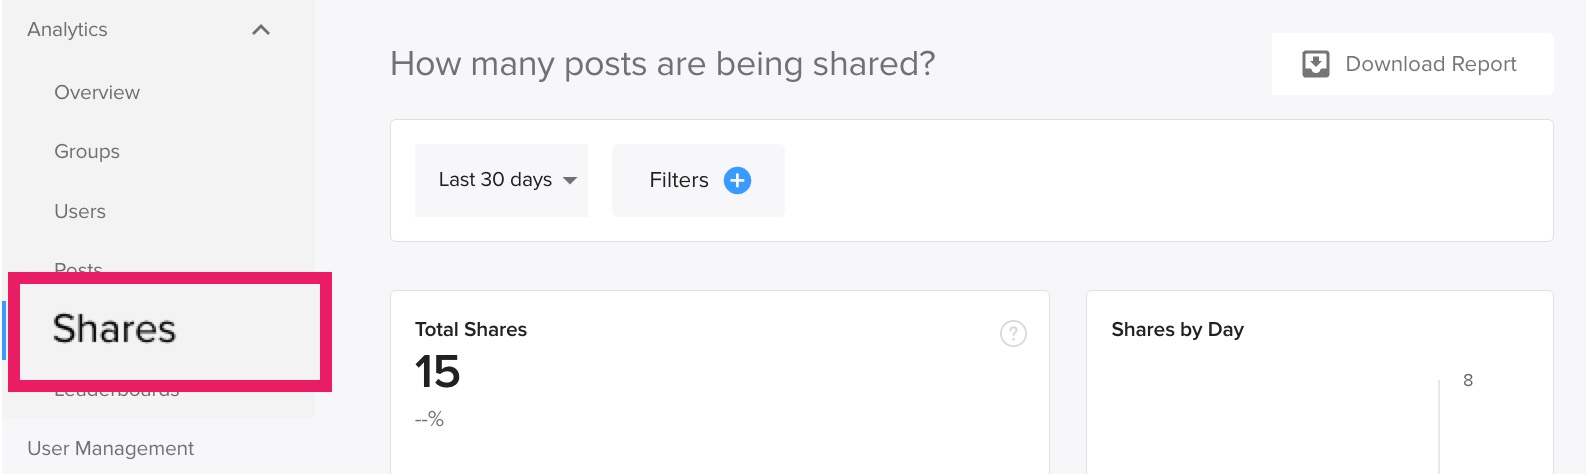
Shares reports
Navigate to Share Analytics by clicking Shares on the left-side menu. You'll then see the Shares dashboard, which presents an overview of how Shares perform—shares, clicks, engagements, and branded content. The report will only show data if the share was made during the selected timeframe. For example, a report that pulls shares for the last 7 days will only show shares made in that time, even if shares made 8 days ago are continuing to receive engagements.
🔹Note: Each network share counts as a single share. A user who shares the same post to LinkedIn and X will have a count of 2 shares, one for LinkedIn and one for X.
In the CSV reports, you'll find
“Summary Report” CSV includes high-level metrics regarding shares your team made to social networks.
- Share details: Users who shared the post, content ID, branded "true" or "false," etc.
- Engagement details: Number of impressions, clicks, shares, and engagements.
“Detailed Report” CSV includes detailed share metrics.
- User details: Name, email, user role, department, location, etc.
- Share details: Shares, clicks, engagements, title, commentary, etc.
- Network-specific data: Total engagements per network, comments on the share, etc.
Click here to view our article about what is included in Share Analytics.
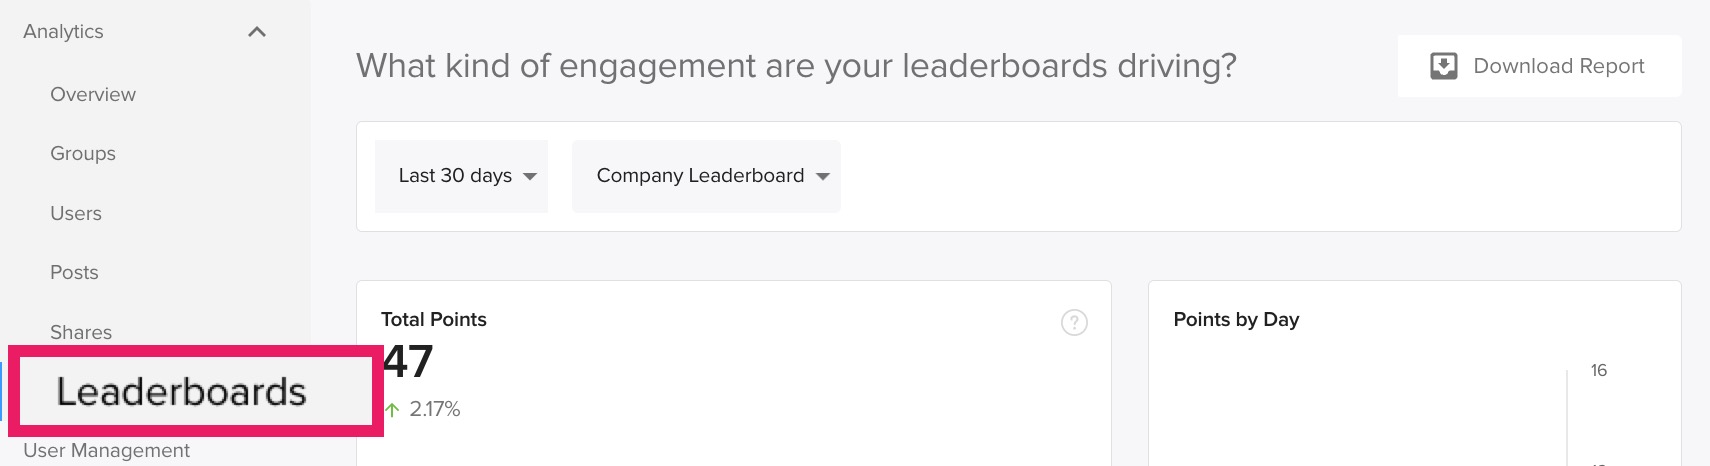
Leaderboards report
Navigate to Leaderboard Analytics by clicking Leaderboards on the left-side menu. You'll then see the Leaderboards dashboard, which presents an overview of how Leaderboards perform—shares, clicks, engagements, and branded content.
In the CSV report, you'll find
- User details: Name, email, user role, department, location, etc
- Point data: Total points accumulated and scoring activities
Click here to learn more about Leaderboard reports.
Downloadable reports
Within each program-specific Analytics item, you have the option to Download Report.
To download a report:
- Select the date range and filters for the report.
- Click Download Report.
- Select a report, if presented options.
- Wait for the download notification.
- Click the notification to begin the download.
Data availability
Here are the two main items to consider when expecting data to be available once an action is taken.
- Actions taken within EveryoneSocial, such as connecting a social network, are seen almost immediately in reporting.
- Actions taken outside of EveryoneSocial, such as clicks and likes, are seen within 24 hours. This is because analytics runs on an Extract, Transform, Load (ETL) to format and arrange data for reporting—and it’s a scheduled process. As soon as the next day rolls around, you should see data regarding external actions.
Each report has a focus and that focus determines what data is pulled. Consider the examples below.
- Shares report pulls data for shares made during the selected timeframe. If the report was pulled for the last 7 days, then it displays data for what occurred on shares made during the last 7 days.
- Posts report pulls data for posts published to EveryoneSocial during the selected timeframe. If the report was pulled for the last 7 days, then it displays data for posts created in the last 7 days.
Using the examples, if a post was created 8 days ago and it was shared in the last 3 days, then you would see data in the Share report but not the Post report.
Report filters
Dashboard reports and downloadable reports will only display data that meet the selected filters and time frame. Date, Department, Location, Segment, and Group filters are available. Filters work on an "or" basis. For example, the image below shows data within the last 30 days from users in the "Human Resources" or "Product" Departments or users in "Chicago.”
Remove filters by clicking the X next to a department or location or clicking Clear Filters.

Glossary
- Clicks: Total number of clicks from shared content.
- Engagements: User post interactions, such as reactions and comments, on content hosted outside EveryoneSocial.
- Network Reach: Total sum of everyone's LinkedIn and X, formerly Twitter, connections.
- Posts: Content posts published in EveryoneSocial.
- Reactions: User post interactions, such as reactions, on content hosted in EveryoneSocial.
- Share: Content shared directly from EveryoneSocial to an external platform.
If you'd like to learn more about the terms used in Analytics, please check out our Glossary.
Looking for more data and metrics available in EveryoneSocial?
🔹 Click here to review all available metrics.
🔸 Click here to review answers to frequently asked questions about analytics and reporting.

If you see data you believe is inaccurate or is unexpected, please connect with our support team and provide as much detail as possible, including but not limited to:
- How you are getting the data?
- What is the reporting period?
- When did you pull a report or get this data?
- Was the data edited in any way, such as columns removed?
- What is the discrepancy?
- What do you expect to see?
Any information provided will greatly help us determine the root cause.